Figure 1: Civilian Unemployment Rate (%)
The unemployment rate declined steadily in 2015.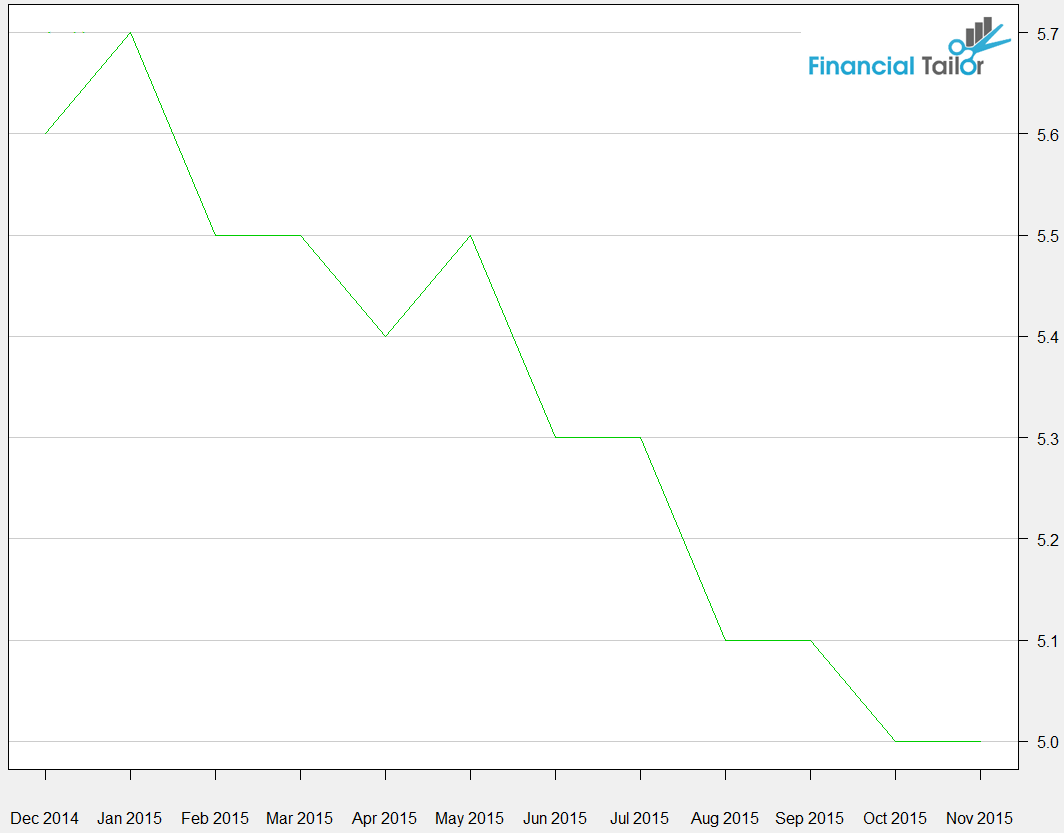
Figure 2: CSI 300
This chart shows the bubble in Chinese stocks this year.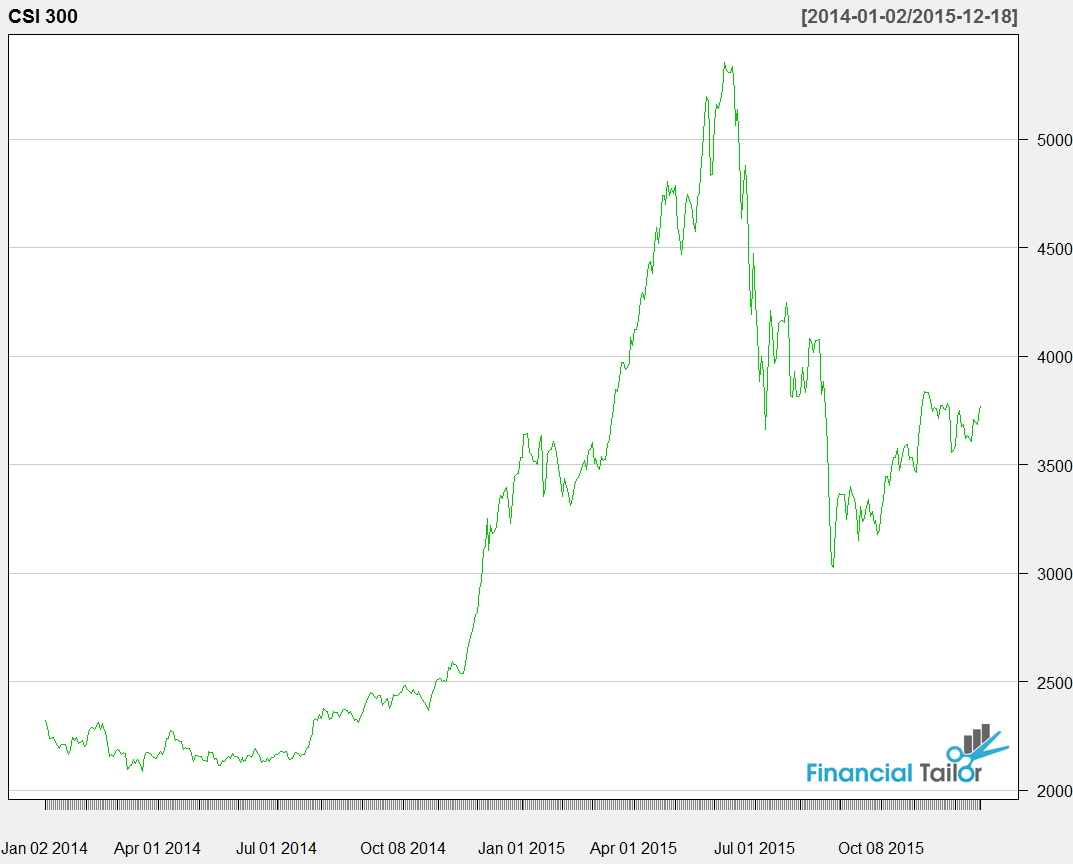
Figure 3: S&P 500
This shows the sideways move and the break of a long term ascending channel.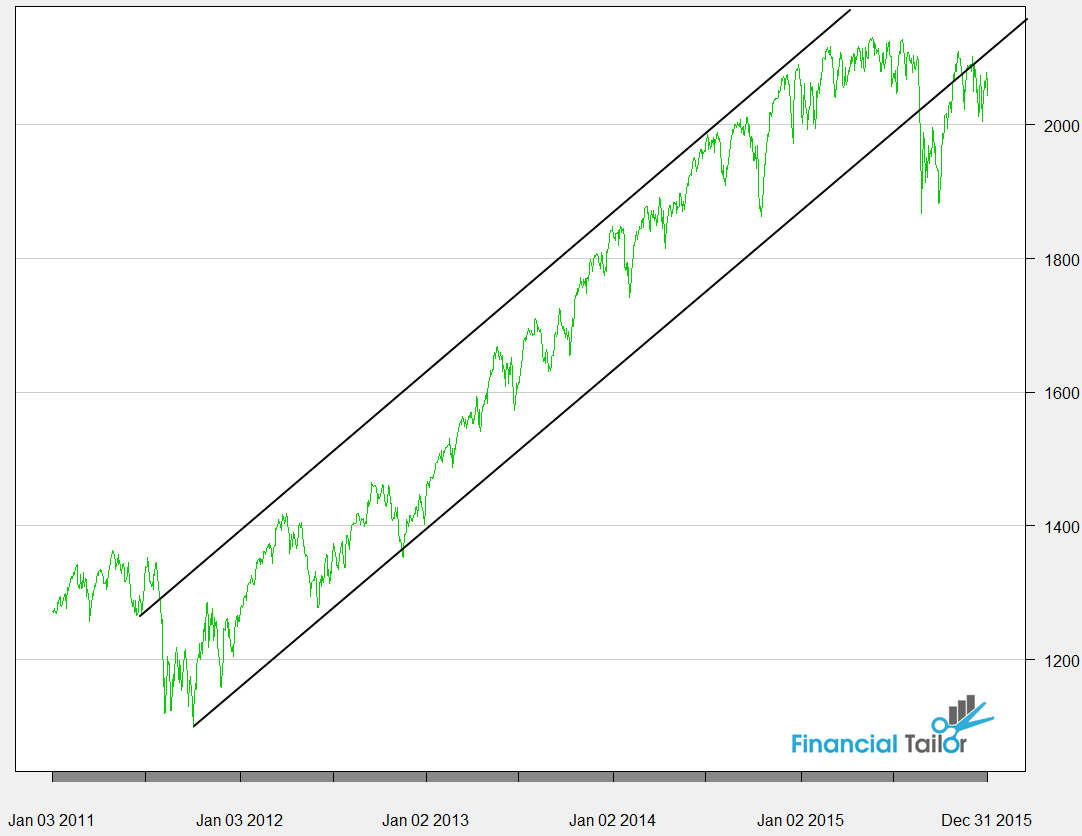
2015 Predictions Recap
Monday 01/04/16
Last year I wrote a post titled 2015 predictions where I made several guesses about various macro events. This week I will go over those point-by-point and look at where I was right and, more importantly, where I was wrong.The unemployment rate which has come down the past few years will stall out. Lost jobs in oil and gas extraction and other commodities based jobs will be a drag on overall employment, but strength in other industries…and a decline in the participation rate will offset some of this.
While there was a significant decline in oil, gas and commodities jobs, it was not enough to offset job gains and the decline in the participation rate. The unemployment rate dropped from 5.7% to 5.0% in 2015.
GDP growth in the U.S. will also be impacted by lower energy prices, and there will be a negative surprise in Q1. However, US GDP will continue to be much stronger compared to other developed nations.
This was a pretty good guess, Q1 was very weak and GDP was hurt because of lower energy prices, but the rest of the world was hit much harder than the U.S.
Small cap stocks will be the outperformer this year compared to large and mid-cap asset classes. Chinese stocks will form a bubble, but will also reverse suddenly and spectacularly. The S&P 500 will bounce around inside the ascending channel shown in the picture on the right, but will end the year below it.
While small caps outperformed during the first half of the year, they lost their lead near the end of the year and ended up underperforming large caps. My logic for this prediction was that small caps wouldn’t have as much exposure overseas and would be less impacted by the strong dollar. I suspect that weakness in biotech was the primary reason for this inaccurate prediction, but there is likely more to it. I was correct in the other two predictions, most impressively with China. I don’t know of anyone else who predicted a huge bubble as well as a massive collapse, which is exactly what happened (see figure 2). From figure 3 you can see that my S&P 500 prediction was also quite accurate.
The dollar will continue to be the outperforming currency. Countries whose budgets depend on oil will be strained and some will experience revolutions as a result (Venezuela being a likely candidate). Australian and Canadian currencies will come under pressure and housing bubbles that have formed in Canada, Scandinavia and elsewhere will deflate. The yen will start the year off strong, but will weaken overall. The European Central Bank will underwhelm investors who were betting on a large-scale quantitative easing program, and the euro will rally at some point this year. The Russian ruble and Turkish lira will experience severe stress.
This was all pretty accurate, the only currency worth owning in 2015 was the US dollar. The commodities producers and emerging markets were both slammed. The ECB did underwhelm investors and rallied strongly late in the year even though the ECB eased significantly.
Commodities will remain weak for most of the year. There will be a wave of mergers and acquisitions in oil and gas companies. US oil production will continue to increase. Oil prices will fluctuate in a huge sideways range all year. Declining demand from China will continue to put downward pressure on commodity prices.
This was accurate as well. Commodities hit multi-year lows and oil prices ended near the lows after moving sideways most of the year, albeit with enormous volatility. Not only U.S., but OPEC and Russia all produced record amounts of oil, while demand slowed in China.
Overall, I would say that there were some really great predictions from last year. Most of these themes were closely related, because they all centered on fundamental weakness in China and emerging markets. I also did not write anything about the December rate hike, which I did not think was likely at the beginning of 2015. Next week I will post another set of predictions for 2016. Have a happy new year!
| Index | Closing Price | Last Week | YTD |
|---|---|---|---|
| SPY (S&P 500 ETF) | 203.87 | -0.48% | -1.4% |
| IWM (Russell 2000 ETF) | 112.62 | -1.19% | -2.32% |
| QQQ (Nasdaq 100 ETF) | 111.86 | -0.41% | -2.11% |
Figure 1: Civilian Unemployment Rate (%)
Figure 2: CSI 300
Figure 3: S&P 500