The CBOE Volatility Index®
This chart shows how the VIX is near historical lows. The VIX is a measure of short term Volatility in the S&P 500 Index.
×

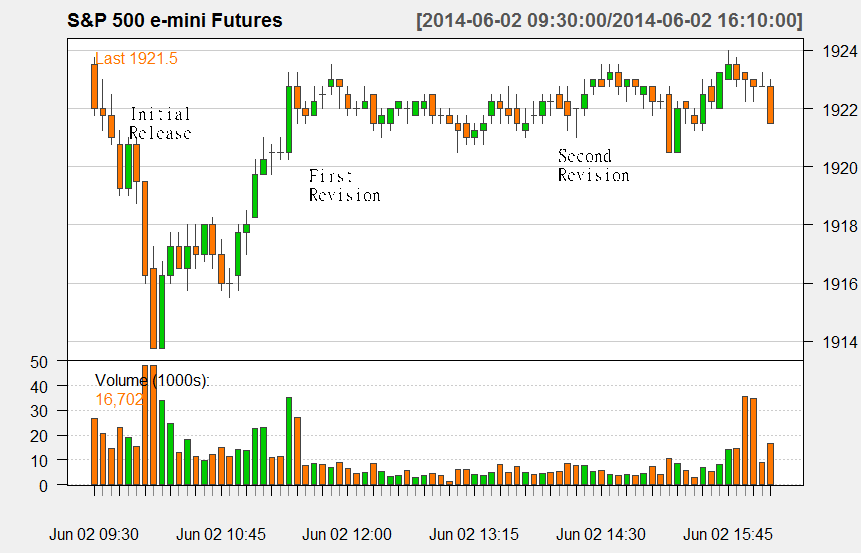
The Day of the ISM Error
This chart shows the S&P 500 futures traded during the day of the ISM error.
×
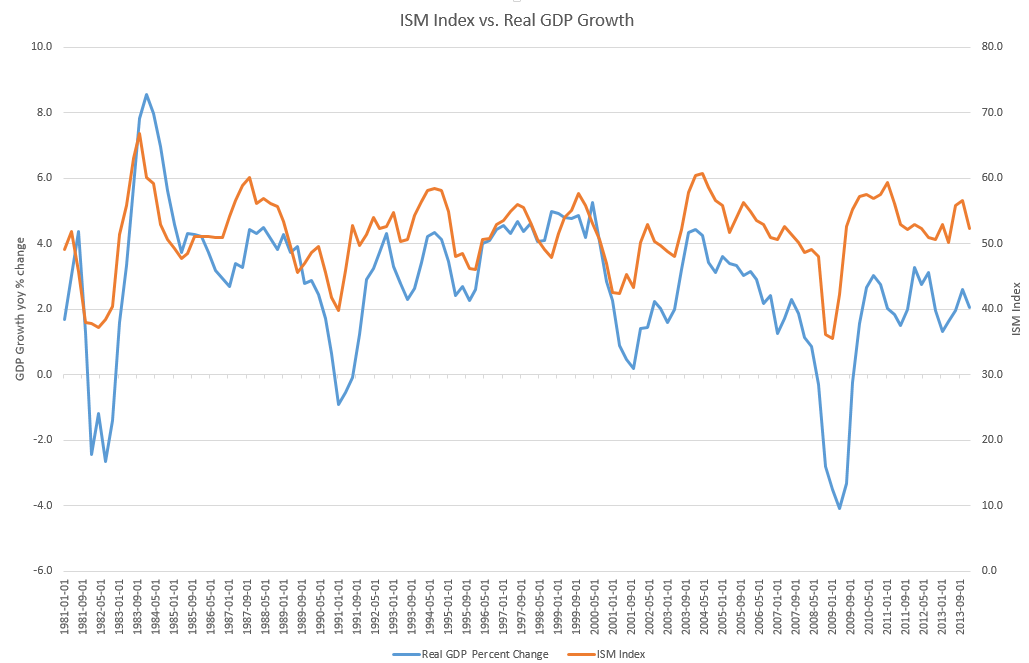
Importance of ISM
This chart shows how the ISM index is great at predicting real GDP growth.
×
ISM Error
Monday 06/09/14
Last week the markets moved higher as volume and volatility have dwindled. Last Monday, the institute of supply management (ISM) initially showed a reading on the purchasing manager’s index of 53.2 for the month of May, this reading stunned a market that was expecting a much higher reading of 55.6 (anything over 50 indicates expansion). However, economist Kenneth Kim at Stone McCarthy noticed that ISM had used incorrect seasonal adjustments to arrive at this number. This led to two different corrections from ISM bringing the final reading to 55.4. Even though the final number was lower than expectations, the market rallied significantly and ended the day well in the green. The second chart on the right shows the market reaction to the bad news and the sudden change of heart as some investors began to notice that the data was incorrect.Investors react strongly to the ISM index, because it has a very strong correlation with real GDP growth. In fact, ISM is probably the best leading index for predicting future growth. The third chart on the right shows how the ISM index rises before booms and falls before recessions. The current reading was ok, but it is important to remember that ISM was coming off a very weak first quarter, which makes me less enthusiastic about the somewhat positive reading.
The most concerning aspect of the misreported ISM number is the potential for insider trading or other nefarious acts by insiders at ISM. While I don’t think this is the case, the potential for someone to recreate this type of situation in the future and profit from it is concerning. The ISM miscalculation was reportedly the result of a coding error that caused their program to read data from April instead of May. An employee at ISM could make a huge profit by purposefully miscoding the application. These types of problems seem to be growing as companies like Google and HP have mistakenly released earnings ahead of schedule because of glitches. It was also discovered last year the Federal Reserve statement was leaked early. Organizations that handle sensitive economic information need to take every possible step to safeguard that information and implement tests to ensure the accuracy of that data.
| Index | Closing Price | Last Week | YTD |
|---|---|---|---|
| SPY (S&P 500 ETF) | 195.375 | 1.26% | 5.9% |
| IWM (Russell 2000 ETF) | 115.88 | 2.49% | 1.33% |
| QQQ (Nasdaq 100 ETF) | 92.82 | 1.52% | 5.45% |
The CBOE Volatility Index®
The Day of the ISM Error
Importance of ISM