Figure 1: Yield Curves
This shows the various types of yield curves. These are all just examples made from fictitious numbers.
×
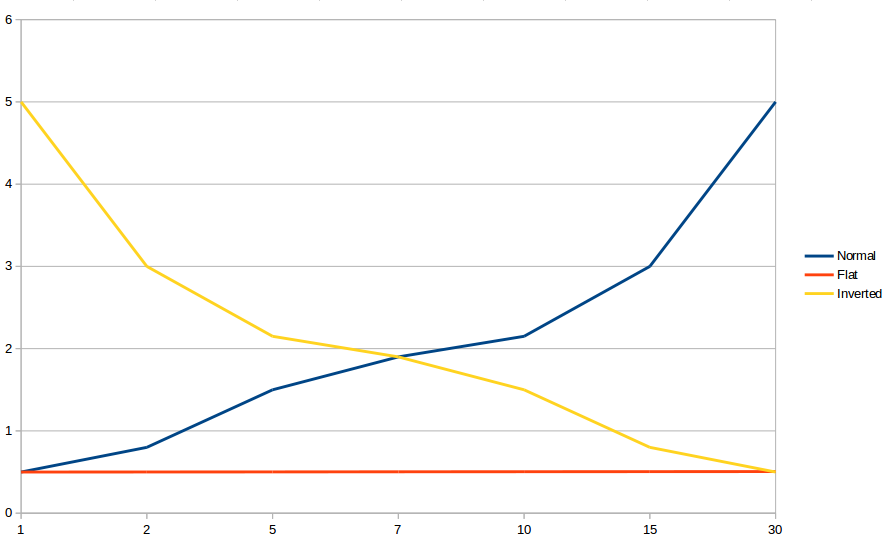
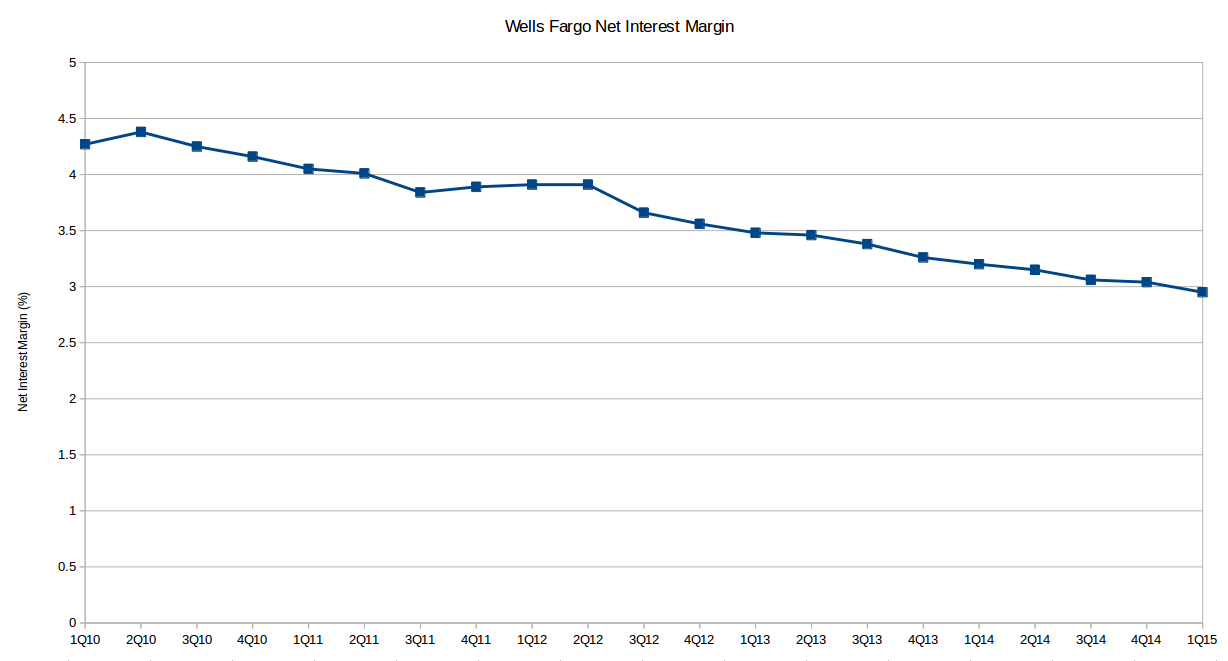
Figure 2: Wells Fargo's Net Interest Margin
This chart shows how falling interest rates have had a major impact on the net interest margin of Wells Fargo.
×
Mission Impossible (Part 2)
Monday 05/18/15
In the last newsletter, I discussed what negative interest rates were and why a negative interest rate environment is such a strange situation. Since that post, interest have reversed direction sharply. Although interest rates on many government bonds are still negative, many no longer are, the Swiss 10 year is no longer negative, but all other maturities less than that still are. This week I want to discuss how interest rates can affect banks.Banks
First let's review two important concepts: net interest margin and the yield curve.
The traditional way that banks make money is to borrow money short term and make long term loans and investments. When banks make money this way, it is measured against their income earning assets and is referred to as their net interest margin. Net interest margin is the difference between interest income generated by the bank and the interest paid on the borrowed funds divided by the average value of the income earning assets.
The yield curve is a graphical representation of yields (rates) across different maturities for bonds of the same type. For example, a yield curve for U.S. treasuries would be created by plotting the yields at different maturities. The data for U.S. treasuries is posted daily at by the treasury here. There are three main types of yield curves: normal, flat and inverted. A normal yield curve is one where short term yields are lower than long term yields. A flat yield curve is when all the yields are about the same. An inverted yield curve occurs when long term rates are lower than short term rates. The inverted yield curve is rare, because it usually signals a recession. In fact all of the recessions since 1970 have been preceded by an inverted yield curve.
The general trend of interest rate direction and the difference between long and short term rates is more important to banks than the nominal values of interest rates. For example, a bank would obviously make more money if it was able to borrow at 1% and lend at 5% than if it could borrow at 5% and lend at 9%. As interest rates have fallen and the yield curve has flattened, the net interest margin at banks has fallen. Figure 2 shows the recent history of Wells Fargo's net interest margin.
But let's consider an environment where short term rates go below zero. Let's say the bank can borrow at -1% and lend at 4%. At this point net interest margin, according to the traditional definition should begin to rise. This is because although the spread is the same, the mix of income changes. In this scenario, income is gained both from lending and from borrowing because the bank is being paid to borrow. In the equation for net interest margin that I gave before, the spread is divided by the average value of income earning assets, but in this case the liabilities also earn income (I apologize if your head is spinning, mine is too). You may think this is just a technicality in the definition; to fix this you could simply include income earning liabilities in the divisor as well.
Now to see why rates shouldn't stay negative for long let's look at a situation where the bank can borrow at negative rates and is also willing to make a loan at a negative rate. In this situation it would be rational for the borrow to take out the largest amount possible, because even if they just stuff the cash in a mattress they can still generate a profit. Of course, this also depends on the rate of inflation and if this situation arises inflation should also appear shortly. However, the risk of default for the business will always remain zero if all their liabilities are denominated in negative rate loans.
My conclusion is that rates can go negative for sustained periods of time, but only slightly and only as long as borrowing increases. As rates go negative and lending increases non-bank borrowers who can get access to negative rates will borrow, which will increase the money supply in the real economy and should lead to inflation. The market will anticipate that increase and interest rates will rise like we saw in the last couple weeks. Therefore, central banks can continue with negative rates as long as inflation remains contained. However, the last people to benefit from this situation would be consumers and small businesses who need money the most, because they will be the last to receive negative rates and if they do inflation would come very soon thereafter.
| Index | Closing Price | Last Week | YTD |
|---|---|---|---|
| SPY (S&P 500 ETF) | 212.44 | 0.41% | 4.13% |
| IWM (Russell 2000 ETF) | 123.65 | 0.86% | 4.86% |
| QQQ (Nasdaq 100 ETF) | 109.58 | 0.75% | 6.84% |
Figure 1: Yield Curves
Figure 2: Wells Fargo's Net Interest Margin